Nearly
a year ago, I was sitting in an incompressible flows class when the professor
said something I had never considered before. Loss of lift over an airfoil
after stall, she claimed, is caused by a pressure increase due to flow
separation over the upper surface.
This
was contrary to everything I thought I knew about separated and attached flow.
Keep flow attached, the conventional wisdom goes, over a tapered shape for greatest
pressure recovery and lowest drag (and “zero lift” on a ground vehicle, if you
believe some people online, which you shouldn’t); if the flow separates, the
pressure drops behind the separation point. Yet in this case, it must be
true that separation increases pressure—otherwise, airfoils would not lose lift
in stall.
Conventional
wisdom, as is so often the case, does not tell us the whole story. The effect
of separation on surface static pressures and, consequently, lift and drag can
be complicated. To investigate, I decided to run some tests.
 |
| You might notice that I repurposed the trailing-edge spoiler from my tail testing for this experiment. Reuse materials as much as you can and testing can be quite cheap, often costing just a little of your time after some small initial investment in materials and equipment. |
Test
1: Separating Flow Over a Hood
First
up, I’ll measure pressures down the centerline of the hood of my car. I know
from having done this before that I can expect to find negative static gauge
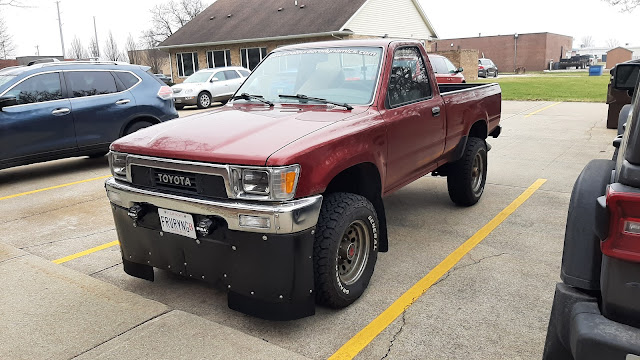
pressures here, but what will happen if I use an angled board to separate the
flow near the front of the hood, similar to what I did on my truck a few years
ago?
Test
2: Separating Flow Over a Curved Roof
Like
Test 1, in Test 2 I’ll use the same board to separate flow but this time over
the roof, just about at the roof peak. I know from having measured pressures here in the past to expect the
lowest static gauge pressures anywhere on the car to show up here. Does detaching the flow over
this nicely curved surface raise or lower those already strongly negative
pressures in the flow downstream of the separation edge?
Test
3: Separating Flow Over a Backlight
Finally,
for this last test I was inspired by something I’ve noticed on production cars.
For a few years now, short overhangs just ahead of and near the outside edge of
the backlight have appeared on a number of cars:
 |
| Image credit: BMW. |
 |
| Image credit: Kia. |
 |
| Image credit: Motor Trend. |
 |
| Image credit: Toyota. |
 |
| Image credit: CivicX.com. |
What’s
going on here?, I wondered. Sometimes these are affixed to cars with backlight
angles that are fairly steep (such as the bZ4X) but more often they show up on
cars with smoothly tapered glass that should be supporting attached flow and
moderate pressure recovery; you can see that the 10th-generation Civic
Type R even included vortex generators in the section between the two fairings,
probably to ensure attached flow there. As I thought about it, I came up with a
hypothesis. I know from measuring pressures on my Prius’ rear window that there
are lower pressures toward the outside of the window than the center (remember,
the flow over cars is strongly 3-dimensional). Perhaps separating
the flow over just the outside edge of the backlight can increase pressure there, reducing both drag
and rear lift? As far as how that might work, my guess is that the trailing vortex that forms
along that edge is causing the drop in pressure there; using a fairing to
deliberately cause flow separation might move the core of the vortex away from
the body and raise pressure.
So,
for my last test I decided to mock up some fairings and measure pressures along
the window with and without them in place. Judging by production cars, these
don’t need to be very tall—especially on the Kias and BMW above, they look like
they’re not large enough to even poke through the boundary layer. You can
estimate boundary layer thickness on your car by


Results
and Discussion
All
pressure measurements above are static gauge pressures, two-way average at 80
kph. Measurement locations are 100mm in front of the leading edge of the
spoiler, 100mm behind the trailing edge, and 300mm behind the trailing edge.
Look
closely at the results and you’ll appreciate why I mentioned that the effect of
separation on static pressures can be complicated. By separating flow at three
different spots on my car, we can see this firsthand: on the hood, static
pressure downstream of separation is increased; on the roof, static
pressure downstream of separation is decreased; and finally, on the
backlight, static pressure downstream of separation has no measurable change.
Clearly, the behavior here is a lot more complicated than “attached flow has
higher pressure and separated flow has lower.” It looks like it matters where
on the car the flow separates and what the local flow field looks like.
Also
note that my hypothesis about the effect of backlight fairings on my car was
incorrect. It may be that these relatively coarse pressure measurements aren’t
sensitive enough to capture whatever change occurred, or it could be that my quick
fairing mockups were not dimensioned correctly (maybe they need to be taller?
Or wider?), or it could be that the flow over my car simply behaves differently
than the cars in the images above due to differences in their shapes. The Prius
has an inset rear window, for example, where both those Kias appear to have
flush glass.
Finally,
since I artificially induced flow separation using a spoiler, you probably
noticed as well that right behind the spoiler (in its “shadow”), pressure did consistently
decrease. However, I was more interested here in observing the behavior further
downstream. That said, one major difference between these tests and the airfoil example which prompted this testing is the artificial inducement of separation; the easiest way to do that is with an inclined edge, so the behavior may be different than if I could, say, change the inclination of the entire car body to create separation somewhere that previously supported attached flow. But these quick tests do show that the effect of separating the flow where it was previously attached is not as simple as you might think—something to keep in mind as you investigate the behavior of fairings and spoilers on your own car.


Comments
Post a Comment